


The market today feels like someone smiling while their house is burning down behind them. Key macroeconomic indicators, geopolitical reality, and technical market signals all suggest one thing: the situation is far from as rosy as it appears. Yet, we’re witnessing the most expensive market valuations in history. Investors are euphoric, markets are on autopilot, and warning signs are being ignored.
Take the new tariffs set to take effect in August—they're expected to reignite trade tensions between the U.S. and the rest of the world. While there’s talk of "agreements" with countries like Japan, they’re more cosmetic than strategic. More striking, however, is how markets respond—or rather, how they don’t. It’s as if the market is just waiting for another excuse to go higher, regardless of substance.
From a technical perspective, we’re seeing clear divergences across indexes and extreme parabolic price movements since April—with no meaningful corrections. Momentum is excessive, and risk is being ignored. While the Fed hasn’t made any major moves yet, markets have priced in three to four rate cuts—something that historically has never happened without an economic slowdown.
The Nasdaq 100 index continues its relentless climb. RSI stands at 71.84—historically signaling overbought conditions. Momentum is high, but prices are now far from the 20-day moving average. This type of behavior often precedes sharp corrections.
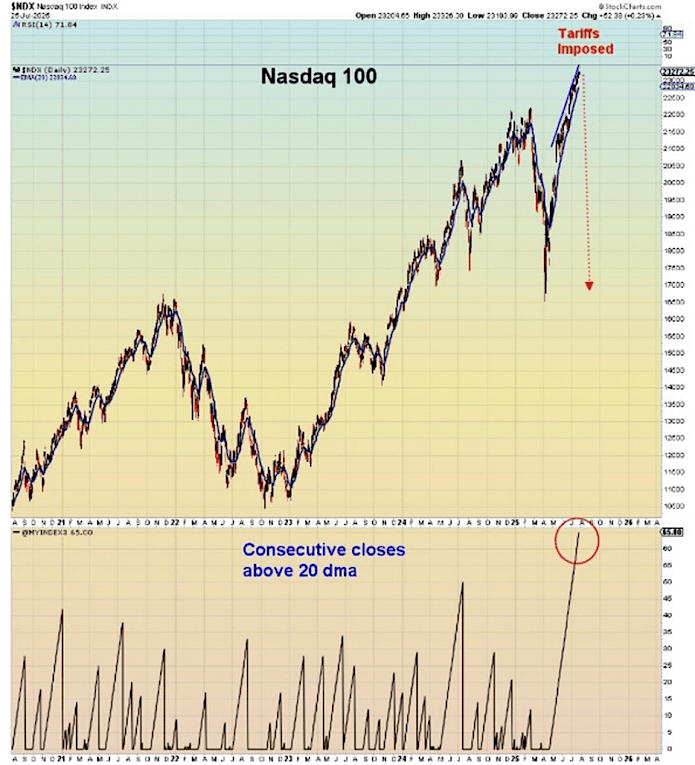
Chart: Nasdaq 100
Top section: Displays Nasdaq 100 from 2021 to July 2025.
"Tariffs Imposed" (top right) marks the announcement of new tariffs (Aug 1, 2025).
Bottom section: Shows consecutive closes above the 20-day moving average—an extended streak often indicating market overheating and increased risk of short-term pullback.
Divergence – When the market says one thing, but indicators say another
Occurs when prices are rising but indicators like RSI or MACD are weakening. It signals that the trend may be losing strength, often preceding a reversal or correction.
Parabolic Rise – When price launches like a rocket (and risks crashing just as fast)
A parabolic move sees prices rising at an accelerating pace. It’s often driven by emotion—euphoria, FOMO—and rarely sustainable, frequently followed by sharp declines.
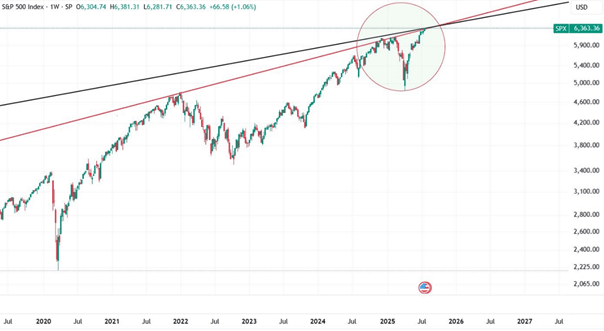
Chart: S&P 500
Shows the index hitting major trendline resistance—often a pivot point for reversals.
This is exactly why we stay cautious. We don't ignore the risks—we see them clearly. We’re not chasing returns at the cost of sound judgment. In an environment like this, caution isn't weakness—it’s discipline.
Across interviews with top executives, the message is consistent: uncertainty. Many CEOs admit they simply don’t know what’s coming. If they don’t, neither can analysts—because there’s a close symbiosis between both worlds.
It’s not just a buzzword; it’s a sentiment shaping real decisions—shrinking planning cycles, postponed investments, hiring freezes. The CEO Confidence Index for Q2 2025 dropped significantly below its long-term average, alongside expectations for spending, hiring, and revenue.
In this chaos, the AI sector stands apart. It’s the one area clearly driving growth. Big tech names like Google and Nvidia are leading the charge. And it’s not just hype—AI brings real value: efficiency, cost savings, better forecasting.
That said, some warnings are valid. Thought leaders like Ray Dalio and Ale Sløk are drawing parallels to the dot-com bubble, warning of overheated sentiment and mispricing. Institutions like Deutsche Bank and Bank of America are monitoring the risk of technological disappointments. Still, AI isn't just hype—it’s delivering results today.
The MTUM ETF, which tracks high-momentum U.S. stocks, is trading near historical highs. Momentum is strong—but dangerously persistent. If sentiment shifts, these stocks could lead the declines.
Momentum measures the speed and strength of a price movement. Strong upward momentum means prices are rising quickly with support from volume, news, or sentiment. Weakening momentum can signal exhaustion and potential reversal.
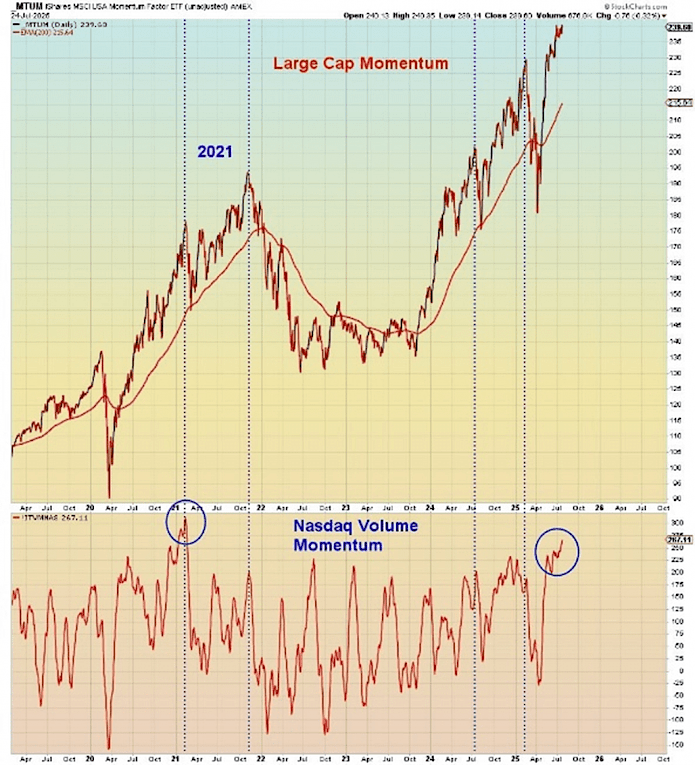
Chart: MTUM ETF
Tracks the iShares MSCI USA Momentum Factor ETF.
The CBOE Volatility Index (VIX) remained low through July but surged +13.68% in August. This is a textbook warning: in overly quiet markets, volatility often returns suddenly.
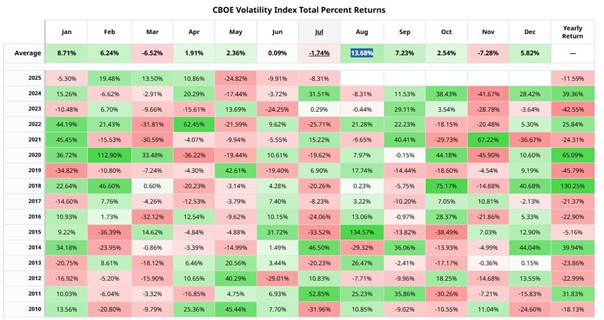
Chart: Seasonal VIX Patterns
Demonstrates the typical seasonal volatility surge in August.
We see the risks. We adapt accordingly. We don't believe markets always know better than reality. We don’t chase performance at the cost of prudence.
10–20% in long-term U.S. Treasury bonds
A hedge against economic slowdown and falling rates.
15% exposure to VIX
The current market calm may not last—this helps in chaotic times.
20% hedge against S&P 500
We’re not betting against the market, just protecting the downside.
20% in cash (mostly USD)
Liquidity gives us flexibility. USD also protects against a weaker CZK.
20% hedge against Nasdaq 100
Again, not a bet against the market—just smart risk management.
30% in cash (mostly USD)
Especially for tech-heavy exposures, where sentiment can shift fast. Cash helps us reenter at better prices.
This isn’t fear—it’s strategy. It’s about managing risk while staying ready to act. The market may outperform us short-term, but with the data at hand and the unpredictability surrounding Trump-era rhetoric, a defensive stance is the wiser path.
Sure, the market could continue climbing despite all signals. But even then—being prepared is still the right call. A healthy pullback would give us the opportunity to lift hedges and deploy cash, adding 5–10% performance upside without unnecessary risk.
We’re not trying to outsmart the market every day. We’re here to be ready when it truly matters.
Back in April, we used the market correction to make strong entries. Since then, growing risks led us to shift more defensively. The dollar has continued to weaken, slightly dragging down our portfolios.
But now, we see technical signs that the dollar could recover. Combined with political uncertainty in the Czech Republic, we expect renewed pressure on the koruna. Looking beyond technicals, U.S. tariff agreements also played a role—though deals like the one with Japan felt underwhelming to us.
Key now are U.S. economic indicators and rate cut expectations. There was no cut in July, but markets are speculating about September. Recent macro data was solid, except for labor market revisions, which suggest a cooling trend. That could raise the odds of a September cut, though markets already price it in.
If stronger GDP numbers arrive, rate cuts could be off the table entirely—potentially pushing the USD back toward 24–25 CZK. Our base case, however, sees a move back toward 23 CZK due to weaker labor data.
Another risk we monitor is inflation. If tariffs start affecting consumer prices—which is already starting—then inflation may accelerate again. This could prevent any rate cuts, unsettle markets, and deepen the slowdown—making recession not just a possibility, but a reality.
In this kind of environment, our current positioning makes absolute sense. We remain focused on delivering what our clients truly deserve.
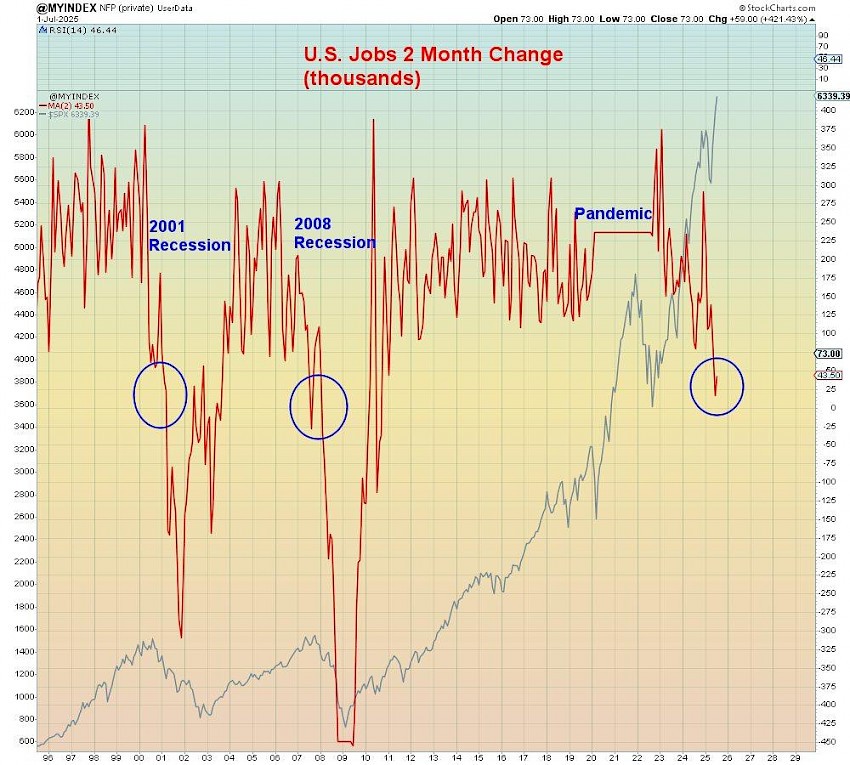
Chart
Depicts U.S. monthly job change (in thousands, red line) and S&P 500 performance (gray line).
Note the sharp recent decline in employment—similar to pre-recession periods in 2001, 2008, and 2020.
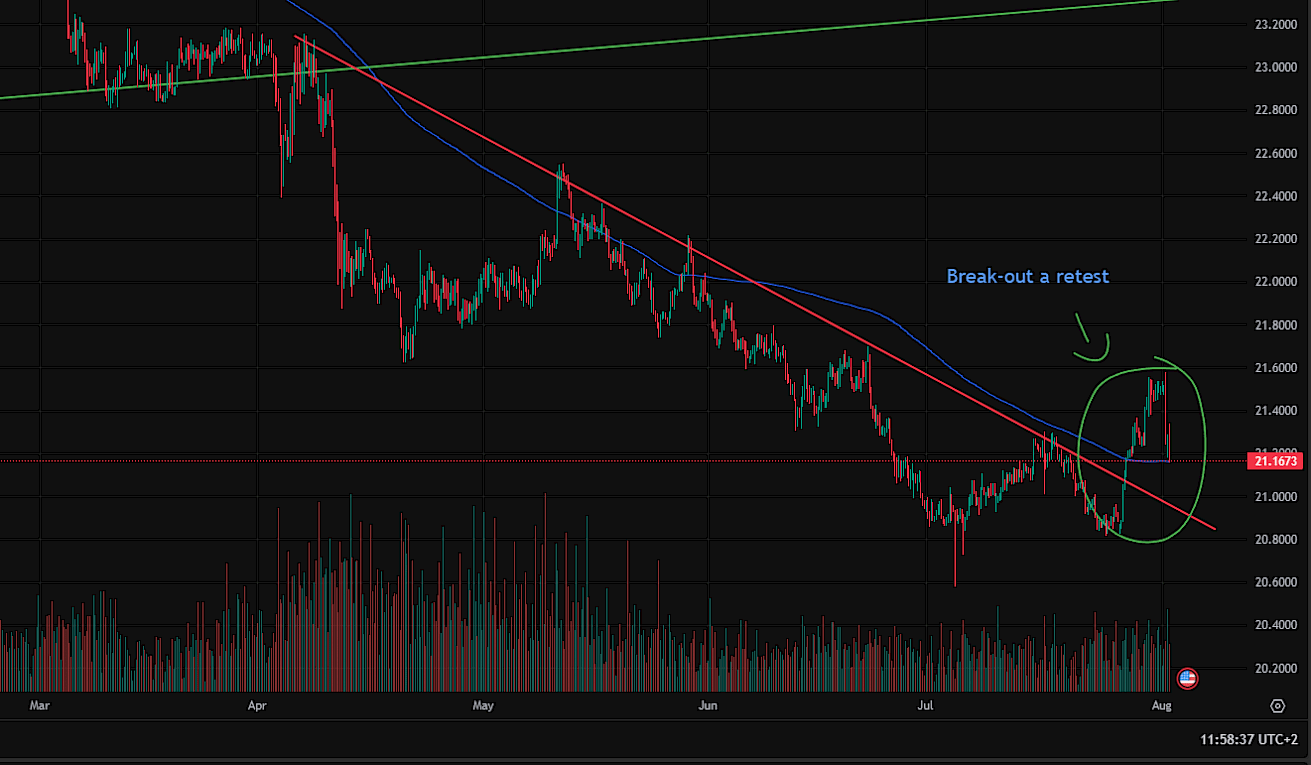
Chart
Shows USD/CZK price action. The long-term downtrend (red diagonal) was recently broken upward, followed by a classic retest—typically confirming a trend reversal.
Disclaimer: This article is for informational purposes only and does not constitute investment advice. Investing in financial markets involves risks. Always conduct your own analysis before making investment decisions.