

The Market Wants to Believe, Bonds Hesitate, and Charts Whisper Warnings
There is a strange atmosphere in the markets. It feels as though the collective investor psyche has decided to focus solely on what's comfortable. And once the market posts a few decent sessions, the fear of missing out begins to surface. It's not quite FOMO yet, but the outlines are taking shape. Risks remain, but at this moment they seem to be losing weight. Negative news is overlooked; positive news is immediately rewarded.
The Market Hears Only What It Wants To
Unemployment in the U.S. remains low, but it is not improving. The consumer is weakening – McDonald’s results indicate this more than macroeconomic data. Household spending is becoming more cautious, yet the market chooses to ignore these signals. Trump is pressing the Fed to lower rates – not only for political reasons but also because the U.S. government will soon need to refinance a significant portion of its debt under better terms.
The Fed is resisting. It has clearly indicated that no rate cut will come before June or July. Inflationary risks persist – tariffs introduced in the latest trade dispute wave have the potential to be inflationary. On top of that, there's the geopolitical layer: the Japanese have openly considered using U.S. Treasury holdings as leverage in trade negotiations. Eventually, they backed down – logically so, given the deep economic alliance between the U.S. and Japan. But the tone has shifted.
Bonds Are Stalling
U.S. 20- and 30-year bonds haven’t moved since the beginning of the year. Yields are fluctuating, but prices remain flat. This is not a sign of stability, but of hesitation. The market is waiting for a clearer direction that has yet to appear. The Fed remains steadfast – even though Trump is pressuring for cuts due to the need to refinance massive federal debt, Powell and the Fed remain unmoved.
The Fed itself is beginning to admit that tariffs may be slightly inflationary. And if inflation remains sticky, no cuts will happen. Looking at SOFR futures, it's clear that markets are still pricing in 75–125 basis points of cuts through the end of 2026 – but those forecasts are beginning to erode.
The next realistic window for a cut? Possibly June. Or maybe July. If not then, we may be in for a long summer of "wait and bleed."
A Fragile Technical Rally
The SPY chart shows an impressive rebound from April’s lows, accompanied by rising volume, RSI above 60, and a bullish MACD setup. The S&P 500 has now posted eight consecutive green days – a statistically rare occurrence, which in the past has often ended in a correction. The average return one month later after such a streak has been -3.13%, with just a 50% chance of a positive outcome.
At the same time, we remain below the 200-day moving average – technically, we are still in bearish territory. Historical experience suggests that technical strength alone isn’t enough if it’s not backed by broad market participation.
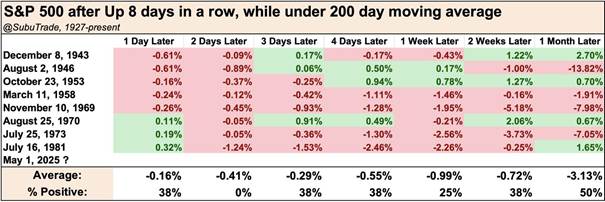
Source: Quantifiable Edges / Index Indicators / or internal backtests on data since 1950
Breadth: Under the Hood, It's Not Pretty
First, what is Breadth? In technical analysis, "breadth" refers to how many stocks are actually participating in a market move – in other words, whether an index’s rise (or fall) is supported by the majority of stocks, or just a few large ones.
The $NYA200R indicator – which measures the percentage of NYSE stocks trading above their 200-day moving average – remains below 40%. This is a weak zone. When the majority of stocks are not rising alongside the index, it signals caution. The recent strong bounce (+12.2% in one day) looks more like a relief rally within a downtrend, not the start of a bull market.
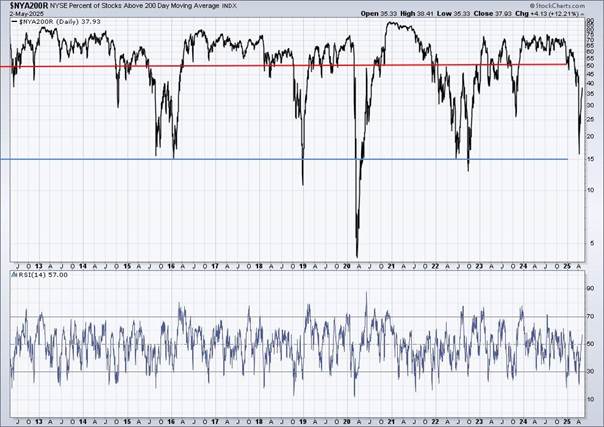
Source: Stockcharts.com / TradingView (user-generated charts featuring $NYA200R)
History Rhymes: Echoes of 1998–1999
The comparison between the current cycle (2021–2025) and the late 1990s is disturbingly accurate. Then, as now, the market dropped by roughly 20% in a short period and then surged. The result was an overheated tech bubble. Today, we see a similar pattern – but with even higher valuations and a still-restrictive monetary policy.
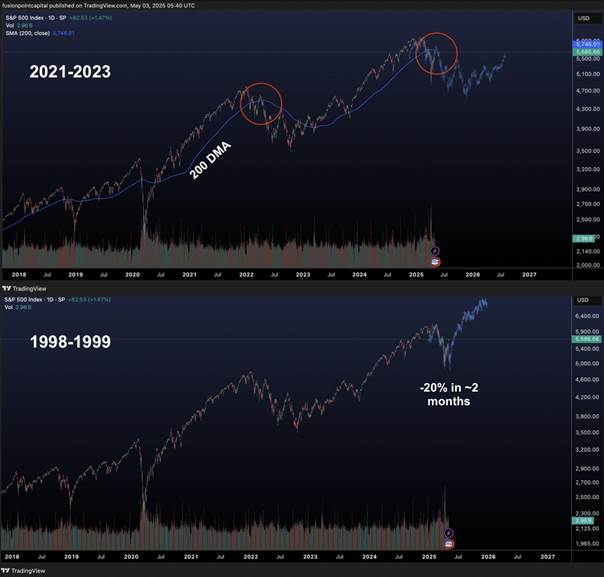
Source: Community-generated technical overlays on TradingView (SPX/QQQ historical patterns)
Volatility and Rate Expectations: The Calm Before the Storm?
The VIX is hovering in the 22–24 range – not extreme, but far from calm. RSI divergence suggests the market may be due for a volatility spike – typically triggered by a catalyst.
That trigger may be shifting rate expectations. SOFR and ASX futures still imply 75–125 basis points of rate cuts by the end of 2026. However, the stability of these expectations is fragile. Should inflation stay elevated or geopolitical risks escalate, a sharp repricing is on the table.
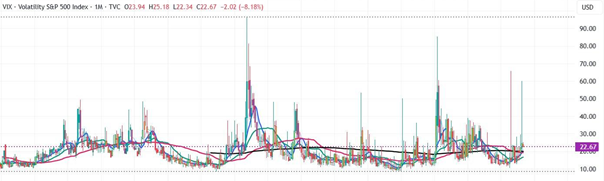
Source: TradingView (VIX index + RSI)
Berkshire vs. the Market: Old-School Still Wins
The performance table of Berkshire Hathaway vs. the S&P 500 highlights a simple truth: value investors may suffer during bubbles, but long-term, they win. Since 1965, Berkshire has returned +5.5 million percent, compared to "just" +39,000% for the S&P 500. In 2024, it outperformed the index by 0.5 percentage points – stability that matters in times of volatility.
The market recently reacted to the announcement that Warren Buffett – the icon and driving force behind Berkshire – will officially step down from leadership on December 31, 2025. BRKB shares reacted negatively, as expected. Markets dislike uncertainty, and this marks the end of an era.
Still, we were not surprised. Buffett is 94, and his departure was only a matter of time. More importantly, Greg Abel – his successor – has been preparing for years and is already operating as a key executive. We believe the transition will be smooth and Berkshire's strategy will remain intact.
Summary: We're on Thin Ice
What Are We Doing?
We took advantage of the April rally to realize profits at key resistance levels. We are now on the sidelines, waiting for more confirmation than the market currently offers. Short-term moves lack depth and breadth, and we’re cautious not to fall into the trap of a second wave of false optimism.
At the same time, we are gradually accumulating certain long-term positions – especially where we see structural growth, solid fundamentals, and persistent demand. This includes Alphabet (Google) and AMD, which we view as core pillars of the next digital and computational wave. We are also building positions in high-quality dividend stocks, which help stabilize returns in a high-rate, volatile environment.
We are also keeping an eye on Brazil, where we see significant regional potential. We have held Vale in our portfolio for some time – it’s a strategic position we plan to continue building. Brazil presents other interesting opportunities as well, particularly in energy, commodities, and infrastructure – sectors likely to benefit from the current shift in global capital flows.
Regarding bonds, we are still near our initial entry prices and are gradually accumulating long-duration U.S. Treasuries (20- and 30-year). We see no long-term scenario where rates stay this elevated indefinitely. Even if it takes years, the upside when the cycle turns will justify the patience.
The only scenario that would force us to reconsider our position is stagflation – a situation where the economy stagnates while inflation remains high. This is a toxic environment for long-dated bonds: yields would rise, prices would fall. In that case, the strategy would be:
For now, we don’t see strong enough signs of a stagflationary regime taking hold – markets continue to lean toward a disinflationary outlook.
Note: This article is for informational purposes only and does not constitute investment advice. Investing in financial markets carries risks, and it's important to conduct your own analysis before making any decisions.